![]()
chronVIEW
chronVIEW offers a highly scalable solution for the visualization and statistical analysis of large hardware traces. It supports the import of data generated by instrumented code, debuggers, tracing tools, and proprietary solutions. chronVIEW enables integration and test engineers to view and analyze recorded data from many different perspectives.
Automated verification of requirements in combination with interactive diagrams contribute to a better understanding of the overall system behavior and the root causes of real-time errors. Deployed in many successful customer projects, chronVIEW has proven to be a driver for reliable decisions and optimizations based on facts.
Trace Import
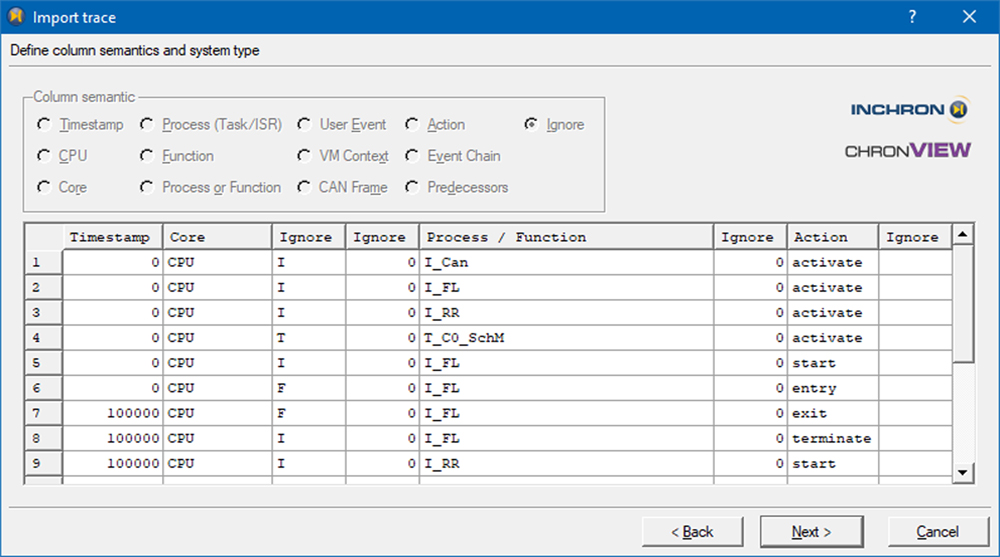
- Import of various standard (e.g. ARTI, BTF, T1) and proprietary trace formats
- Intelligent wizard with built-in error detection, indication, and correction
- Full support of multi-core and multi-CPU traces
- Capable of handling very large traces
- Trace merge assistance
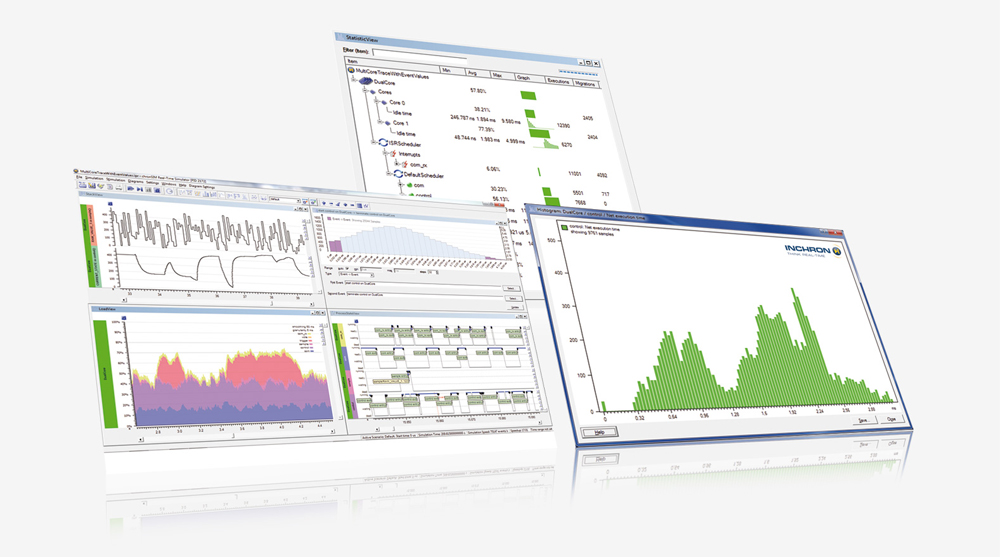
Trace Analysis
- Visualization of RTOS scheduling, function nesting, data and control flow, user-defined events and event sequences, data values and rates, stack consumption etc.
- Verification of timing requirements
- Continuous traceability of requirements (e.g. for IBM DOORS)
- Extensive statistical analysis and data extraction capabilities
- Automated model generation for simulation and analysis
- Report generation in HTML and CSV with fully customizable templates
- Batch mode for workflow automation
Test Data
Test Data
Test Data
Test Data
Test Data
Copyright ©2020.All Rights Reserved.